

Planning Diwali gifts for your clients, partners, or employees?
We’ll help you choose Diwali gifts that fit your budget and brand—quick, simple, and hassle-free. Just reach out to our team and we’ll take care of the rest.
 4.8 out of 5 ★★★★★ by 1100+ brands
India’s hiring landscape is changing across industries, cities, and experience levels. From rising demand for AI and technology professionals to differences in youth unemployment, salary expectations, and work preferences, these statistics offer a closer look at the country’s employment market.
This statistical roundup brings together key figures on hiring growth, job creation, workforce participation, career mobility, and workplace technology. Whether you are a job seeker, employer, or HR professional, these numbers can help you understand current hiring patterns and the challenges shaping India’s workforce.
Methodology
We collected hiring statistics in India from reports published by Naukri JobSpeak, the International Labour Organization (ILO), the Directorate General of Employment, ACCA, and Statista. As the statistics cover different reporting periods, readers should check the original sources (attached at the end of the article) for the dates and context of each figure.
Key hiring and recruiting statistics in India at a glance
- India’s white-collar job market grew 5% in July 2026 versus the same month in 2025, with the hiring index rising from 3,074 to 3,227.
- Hiring for AI and machine learning roles increased by 33% year-on-year in July 2026, reflecting growing demand for specialized technical skills.
- Recruitment in architecture and interior design grew 13% year-on-year in July 2026.
- Hiring for entry-level professionals with up to three years of experience rose by 6% year-on-year in July 2026.
- Bhubaneswar and Gandhinagar recorded annual hiring growth of 24% and 23%, respectively, in July 2026.
- India’s unemployment rate among people aged 15 and above dropped from 6% in 2017–18 to 3.2% in 2022–23.
- Young people made up 82.9% of India’s unemployed population in 2022, underscoring the employment challenges facing younger workers.
- The unemployment rate among graduate youth aged 15–29 stood at 29.1% in 2022.
- In 2026, 81% of surveyed Indian finance and accounting professionals planned to ask for a salary increase within the next 12 months, up from 67% in 2025.
- Hybrid work remained a popular choice among surveyed Indian finance and accounting professionals, with 79% preferring it in 2026 and 53% already working in a hybrid arrangement.
1. India hiring trends and job demand
India’s hiring market shows demand across AI and machine learning, IT services, and recruitment. Hiring growth varies by experience level and business needs, making it useful to track both overall hiring activity and demand for specific skills.
- India’s white-collar hiring rose 5% year-on-year in July 2026, with the Naukri JobSpeak index climbing from 3,074 in July 2025 to 3,227 in July 2026.
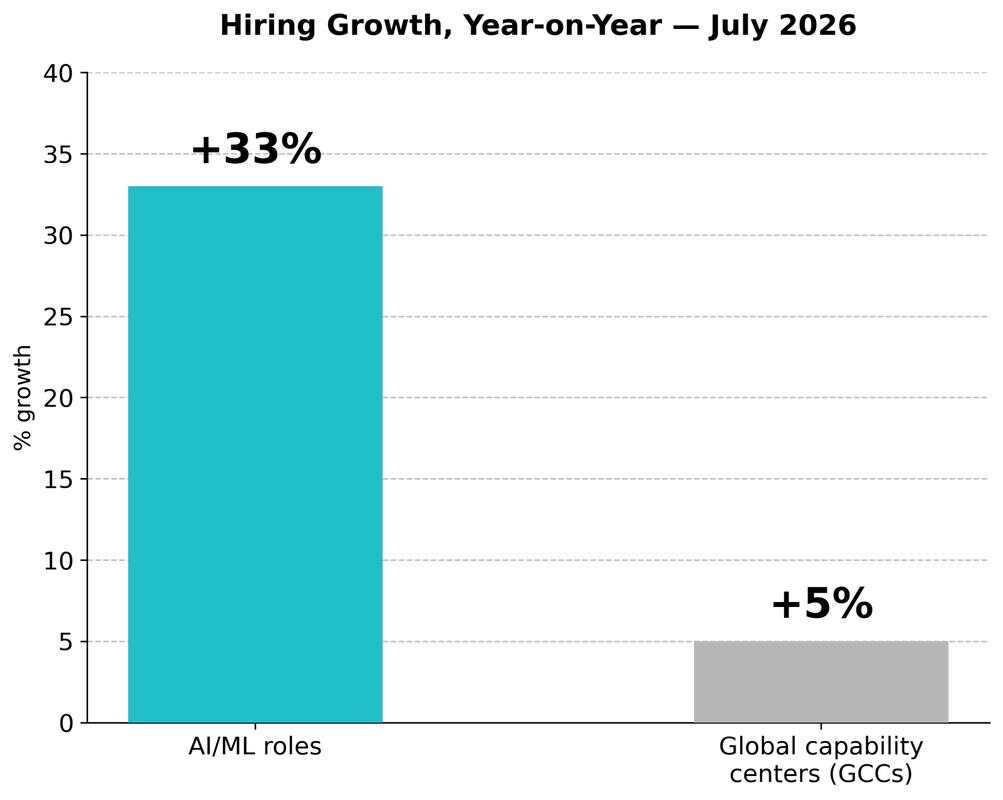
- Hiring for artificial intelligence and machine learning (AI/ML) roles grew by 33% year-on-year in July 2026, making it the fastest-growing hiring category that month. Hiring at global capability centers (GCCs) increased by 5%.
- Hiring in IT and software services rose 6% year-on-year in July 2026, while hiring at IT startups grew 5%.
- Hiring activity in the recruitment sector rose by 54% year-on-year in July 2026, with the Naukri JobSpeak index increasing from 703 in July 2025 to 1,083 in July 2026. This index measures changes in recruitment activity, not the number of recruiters hired.
2. Hiring trends by industry
Hiring trends differ across industries. Insurance, healthcare, real estate, construction, and architecture have grown, while some sectors, including education and banking, have declined. These differences can help job seekers identify sectors with stronger hiring activity.
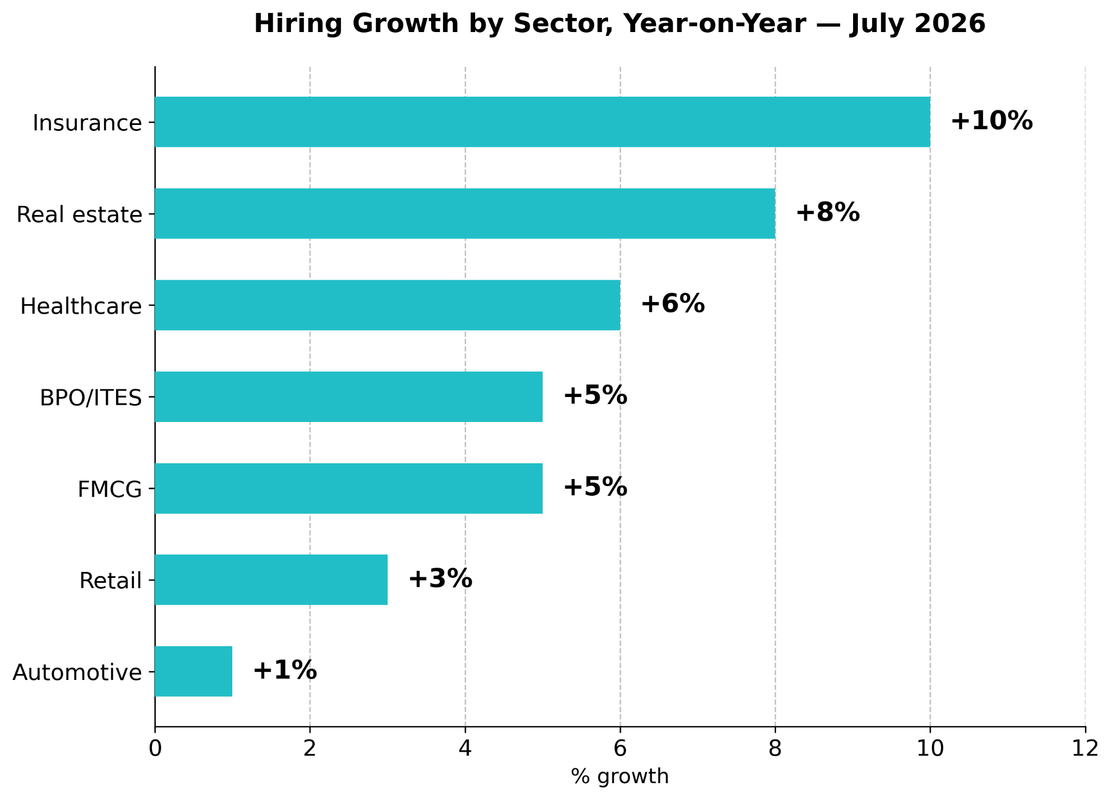
- Insurance hiring grew 10% year-on-year in July 2026, while real estate hiring rose 8%, healthcare 6%, BPO/ITES 5%, FMCG 5%, retail 3%, and automotive 1%.
- Hiring in architecture and interior design increased by 13% year-on-year in July 2026, indicating stronger recruitment activity than in July 2025.
- Gems and jewelry hiring rose 14% year-on-year in July 2026, while defense and government hiring rose 17%, aviation and aerospace 11%, and construction, engineering, cement and metals 9%.
- Several industries recorded lower hiring activity in July 2026. Education hiring fell by 12% year-on-year, followed by hospitality at 7%, pharma/biotech at 6%, banking and financial services at 5%, and telecom at 4%.

- Manufacturing accounted for 38.5% of employment across nine selected non-farm sectors in January–March 2022. Education accounted for 21.7%, and IT/BPO accounted for 12% during the same period.
- Employment in IT/BPO across the selected non-farm sectors increased from 20.79 lakh in April–June 2021 to 38.31 lakh in January–March 2022.
3. Hiring trends by experience level
Hiring demand varies by career stage, from fresh graduates to senior professionals. Entry-level opportunities are growing in some sectors, while demand for experienced professionals is rising across several experience bands. This helps job seekers understand where their experience may fit current market needs.
- Hiring for freshers with 0–3 years of experience grew by 6% year-on-year in July 2026, driven by demand in non-IT sectors such as insurance and FMCG.
- Hiring for professionals with 4–7 years of experience rose 3% year-on-year in July 2026, while hiring for those with 8–12 years of experience rose 7%.
- Hiring for professionals with 13–15 years of experience grew by 8% in July 2026, the highest increase among the listed experience groups. Hiring for professionals with 16 or more years of experience grew by 1%.
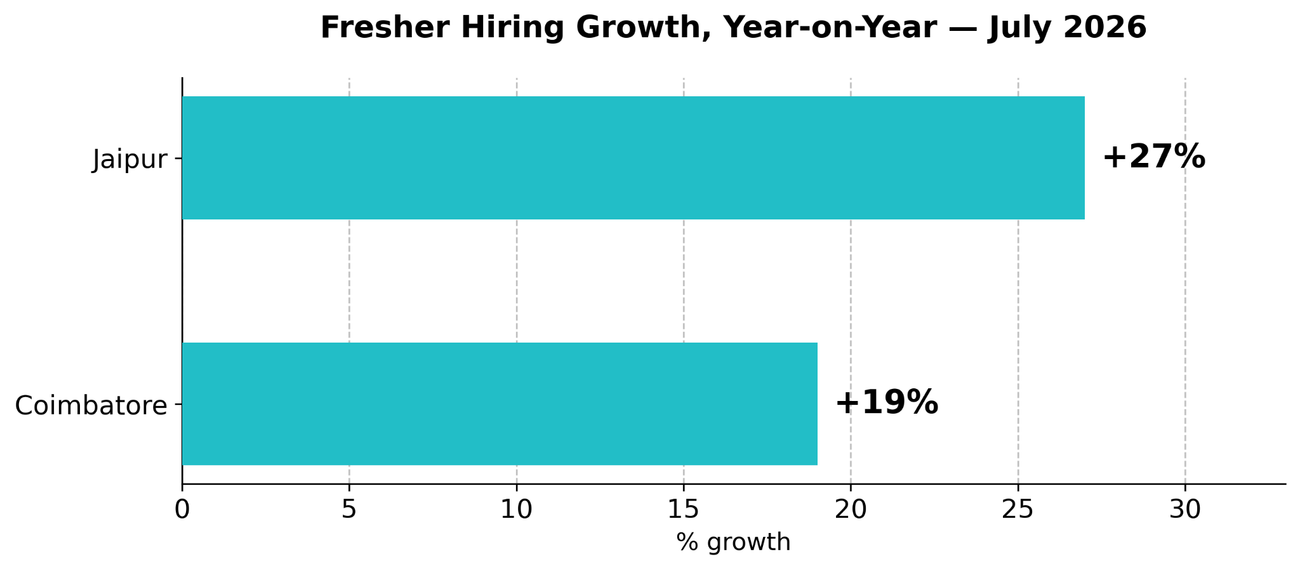
- Jaipur and Coimbatore recorded 27% and 19% year-on-year growth in fresher hiring, respectively, in July 2026.
4. Hiring trends by city
Hiring activity varies across Indian cities, with some emerging markets growing faster than established employment hubs. Comparing city-level trends can help candidates decide where to search for jobs and help employers assess locations for recruitment.
- Bhubaneswar recorded 24% year-on-year hiring growth in July 2026, followed by Gandhinagar at 23% and Kolkata at 17%.
- Hiring activity rose 16% year-on-year in both Raipur and Hyderabad in July 2026, making these cities among the fastest-growing hiring markets.
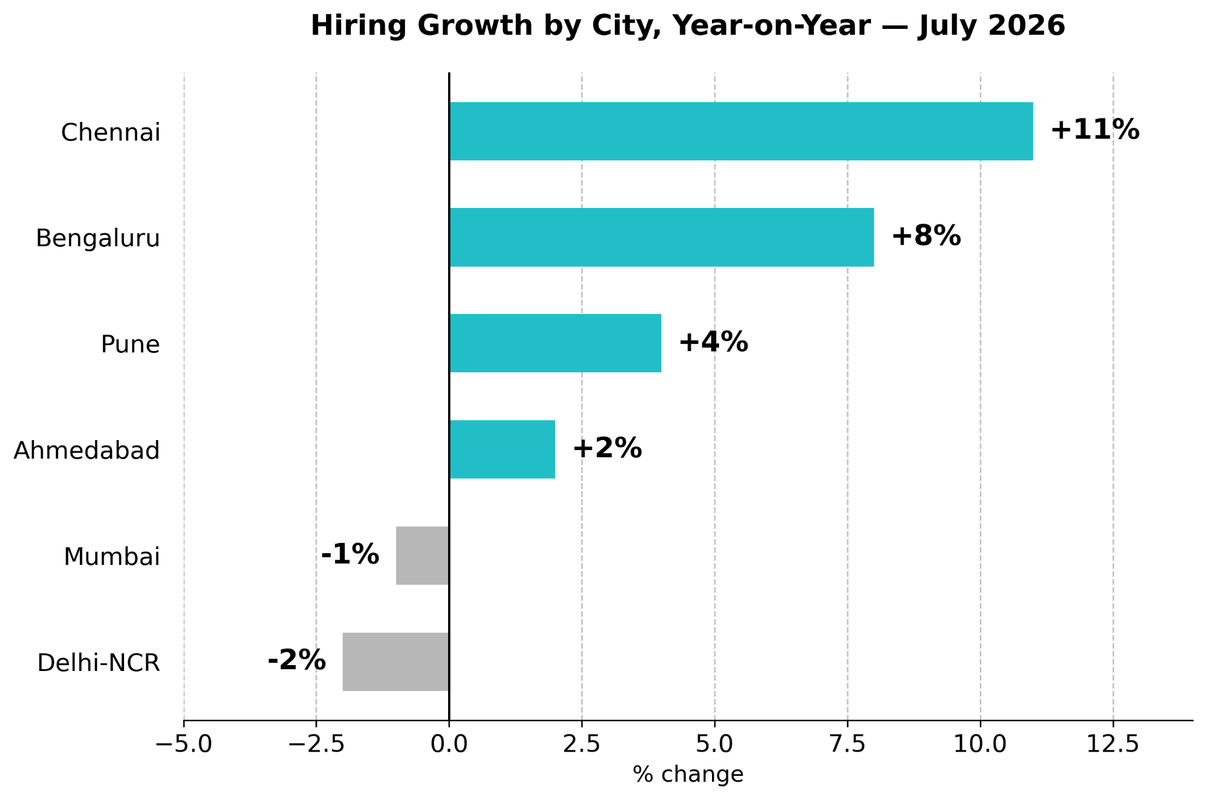
- Chennai recorded 11% year-on-year hiring growth in July 2026, while Bengaluru grew by 8%, Pune by 4%, and Ahmedabad by 2%. Hiring declined by 2% in Delhi-NCR and 1% in Mumbai.
- Hyderabad’s overall hiring grew by 16% year-on-year in July 2026, supported by 22% growth in hiring at global capability centers (GCCs), which handle business and technology functions for multinational companies.
- Other cities recorded positive year-on-year hiring growth in July 2026, including Nellore at 18%, Rajkot at 16%, Indore at 10%, and Nashik and Guwahati at 9% each.
5. Employment by sector and job creation
Employment data covers job creation across formal and informal work, as well as major sectors such as IT, tourism, and village industries. These figures provide a broader view of where people work and how employment opportunities are distributed across the economy.
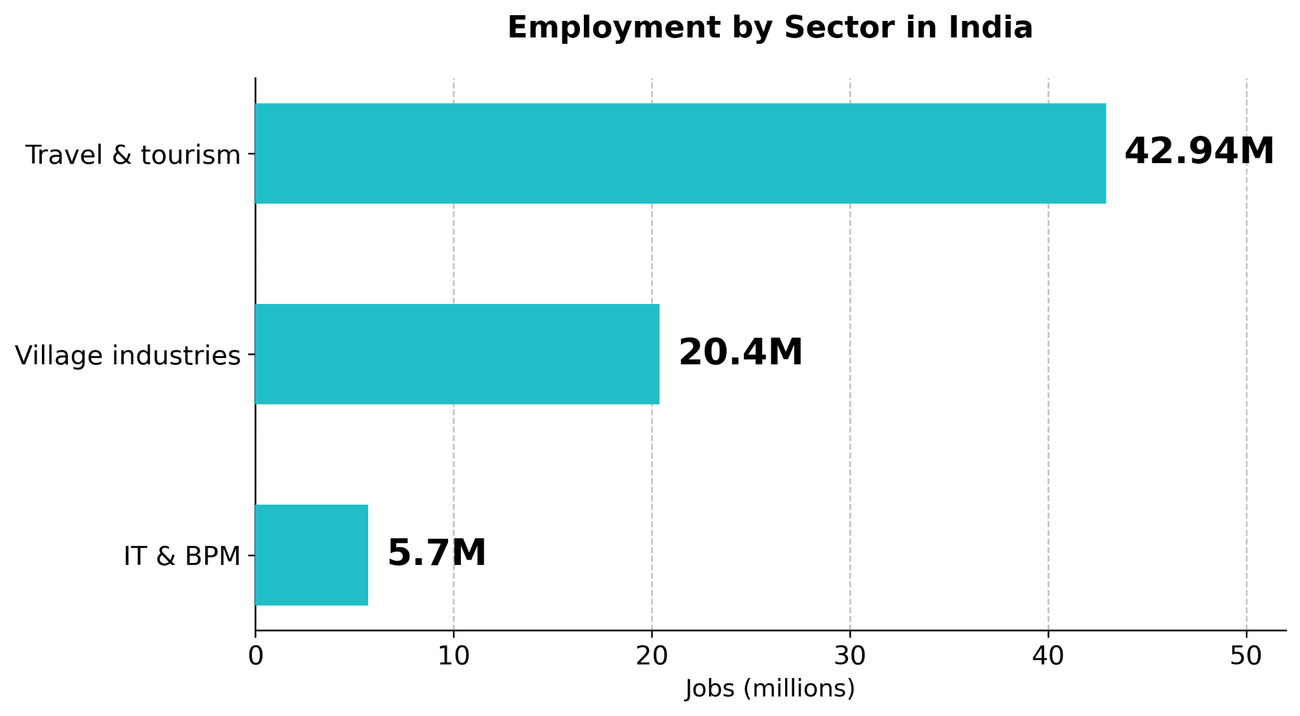
- India’s IT and BPM sector employed 5.7 million people, while the travel and tourism sector supported 42.94 million jobs. Village industries employed another 20.4 million people.
- Around 4.75 crore additional people entered employment between 2018–19 and 2019–20. About 65% of these additional workers were self-employed, not employees.
- About 91% of additional workers in 2019–20 were in the unorganized-informal sector, indicating that most of the reported employment increase occurred in informal work.
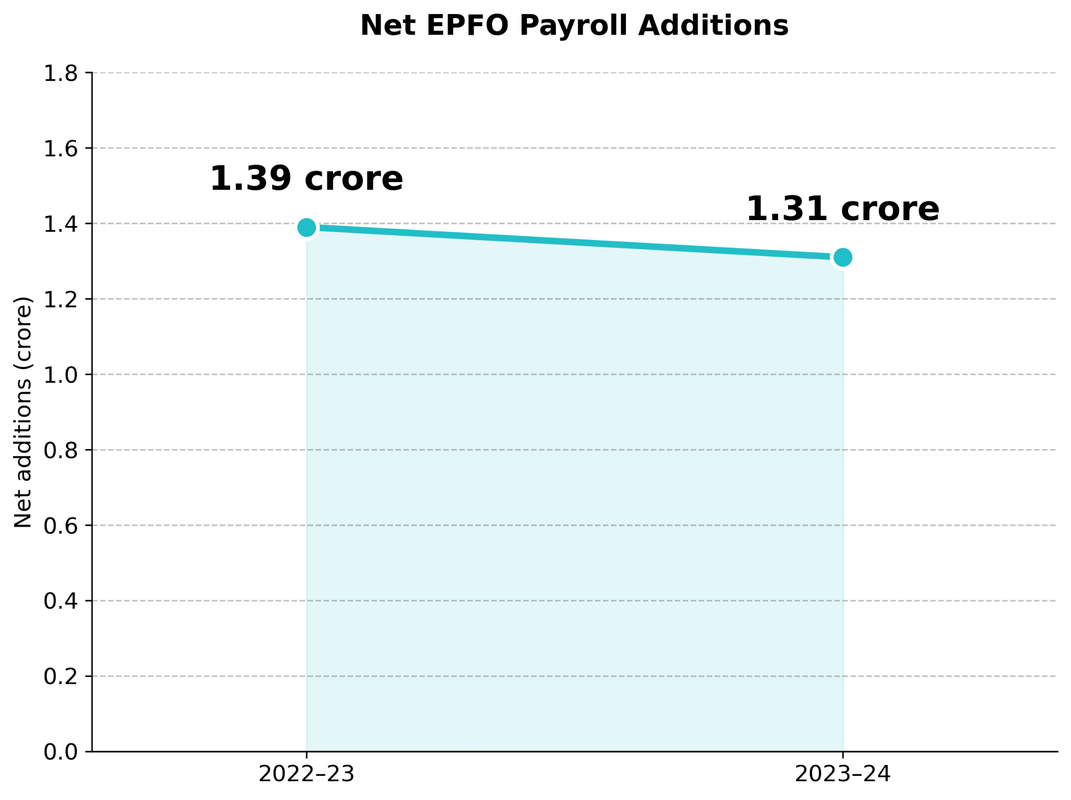
- Net EPFO payroll additions reached 1.39 crore in 2022–23, before declining to 1.31 crore in 2023–24. These figures represent net additions to payroll subscriptions, not the total number of newly hired people.
- Employment across nine selected non-farm sectors increased from 3.08 crore in April–June 2021 to 3.18 crore in January–March 2022.
6. Unemployment and labor force participation
Unemployment rates and labor force participation help explain how people engage with the job market. Differences between rural and urban areas, along with changes in women’s participation, offer insight into employment access and workforce trends.
- India’s unemployment rate among people aged 15 and above fell from 6% in 2017–18 to 3.2% in 2022–23.
- In 2022–23, the unemployment rate was 5.4% in urban areas and 2.4% in rural areas, with urban unemployment higher.
- Urban unemployment reached 20.8% in April–June 2020, before falling to 6.6% by April–June 2023.
- India’s female labor force participation rate rose from 23.3% in 2017–18 to 37% in 2022–23. This measures labor force participation, not the percentage of women employed.
7. Youth unemployment and graduate employability
Youth unemployment remains an important measure of the education-to-employment gap. Comparing unemployment rates by age and education level helps show the challenges young people face when entering the workforce, particularly those with secondary or graduate qualifications.
- India’s youth unemployment rate rose from 5.7% in 2000 to 17.5% in 2019, before falling to 12.1% in 2022 and 10% in 2023.
- Young people accounted for 82.9% of India’s total unemployed population in 2022, making up the majority of unemployed people that year.
- The unemployment rate among graduates aged 15–29 reached 29.1% in 2022. In the same year, unemployment among youth with secondary education or higher was 18.4%, compared with 3.4% among young people who could not read or write.
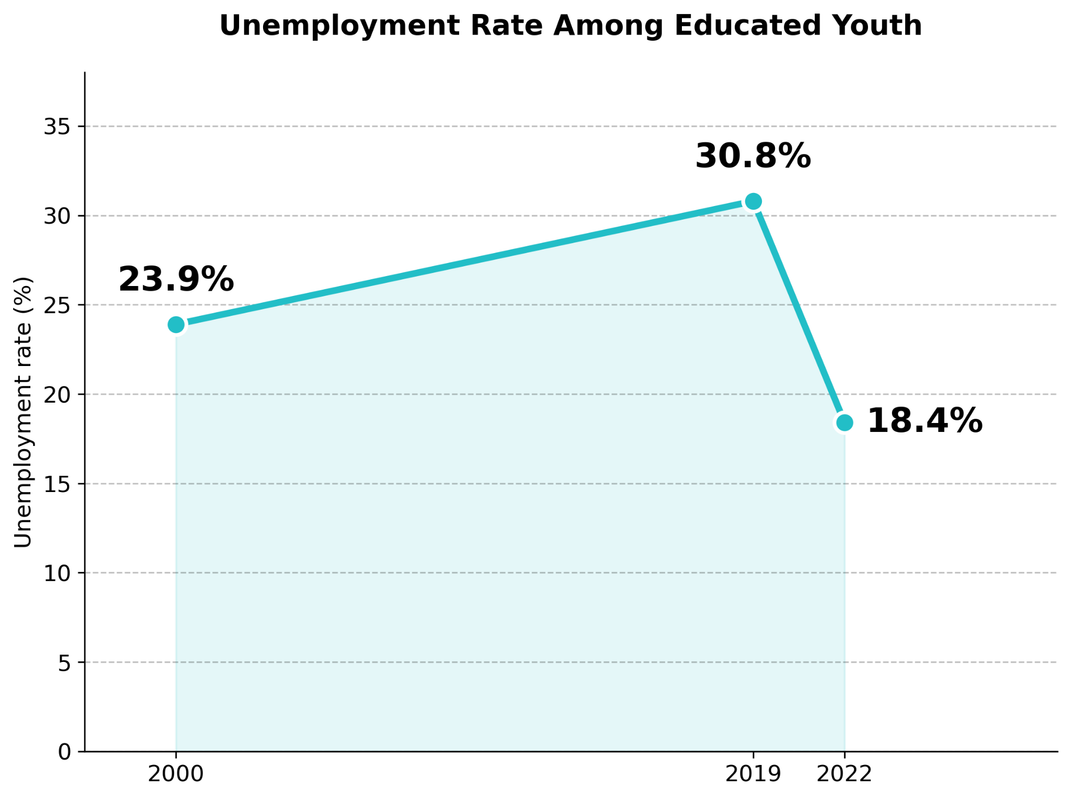
- The unemployment rate among educated youth rose from 23.9% in 2000 to 30.8% in 2019, then fell to 18.4% in 2022.
- The share of unemployed people with secondary education or higher rose from 54.2% in 2000 to 65.7% in 2022, indicating that educated people made up a larger share of the unemployed population.
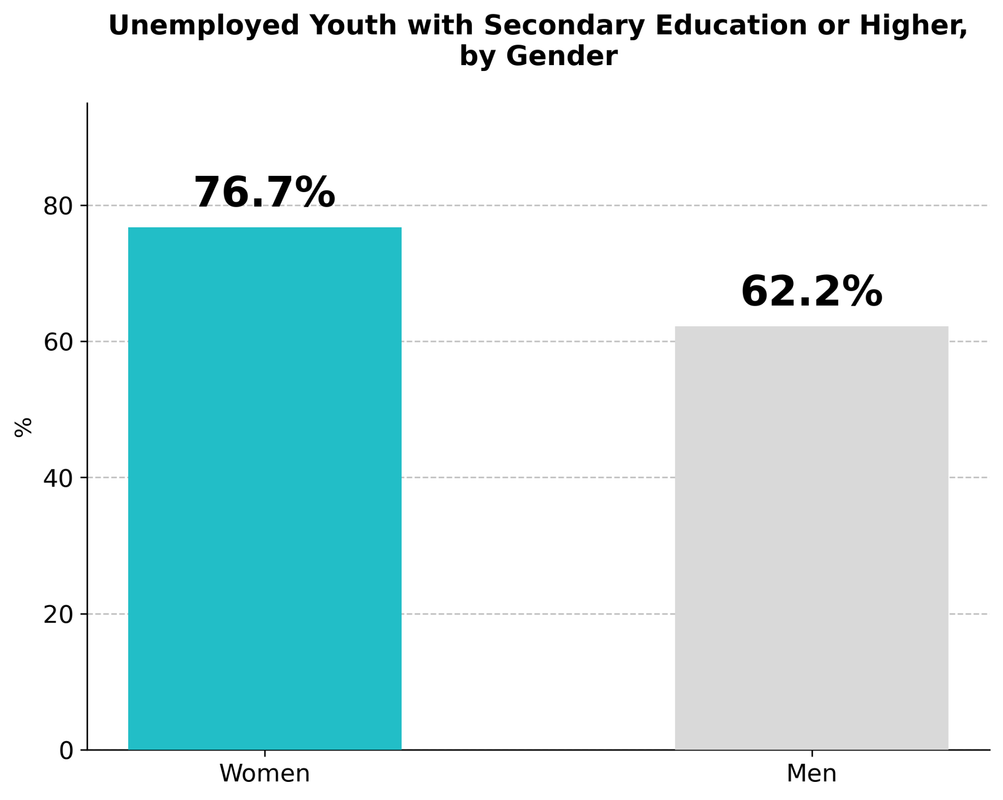
- Women made up 76.7% of unemployed young people with secondary education or higher, compared with 62.2% of men.
8. Gender representation and leadership
Women’s workforce participation and representation in senior management reveal important differences in employment outcomes. These figures help assess women’s access to work, career progression, and leadership opportunities in India.
- Women held only 6% of top managerial positions in India, highlighting their limited representation in senior leadership.
- Female labor force participation rose from 23.3% in 2017–18 to 37% in 2022–23, indicating that more women participated in the labor force.
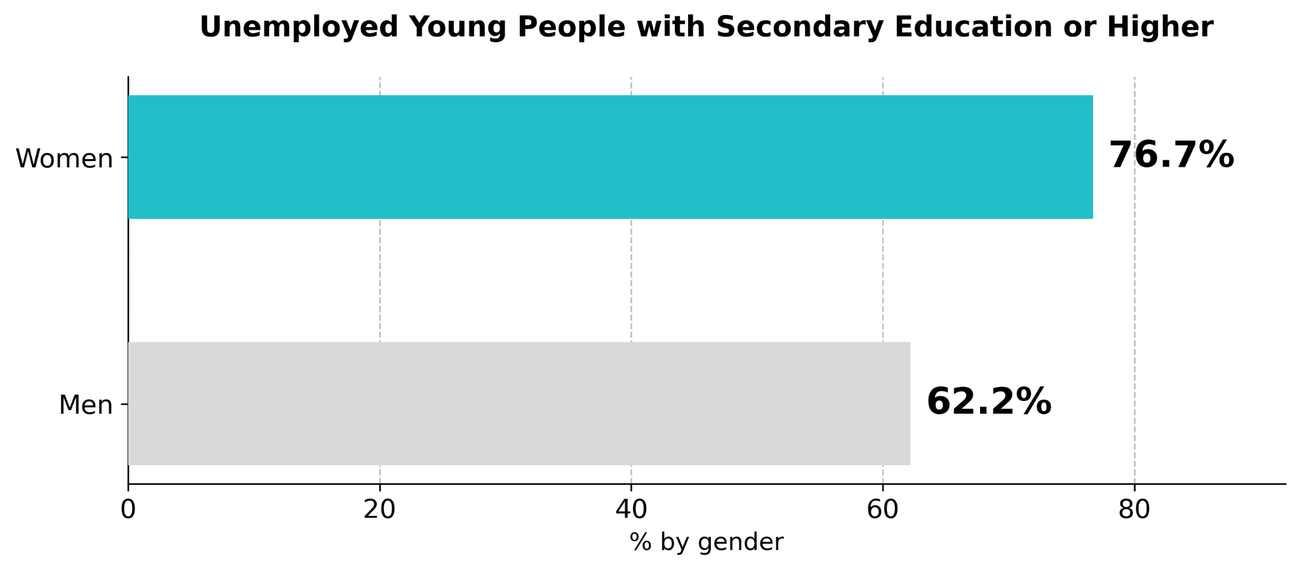
- Among unemployed young people with secondary education or higher, women represented 76.7%, compared with 62.2% for men.
9. Job security, retention and career mobility
Job security and career mobility influence how employees approach their careers. Survey findings on job stability, career changes, and entrepreneurial ambitions provide insight into what professionals want from their current roles and future employment.
- In 2026, 47% of Indian finance professionals wanted to move to their next role within 12 months, down from 55% in 2025.
- In 2026, 60% of Indian finance professionals felt secure in their current roles.
- More than 90% of Indian respondents wanted at least one steady job. Of these, 57% preferred a stable role alongside some freelance work, while 36% preferred a single steady role with one employer.
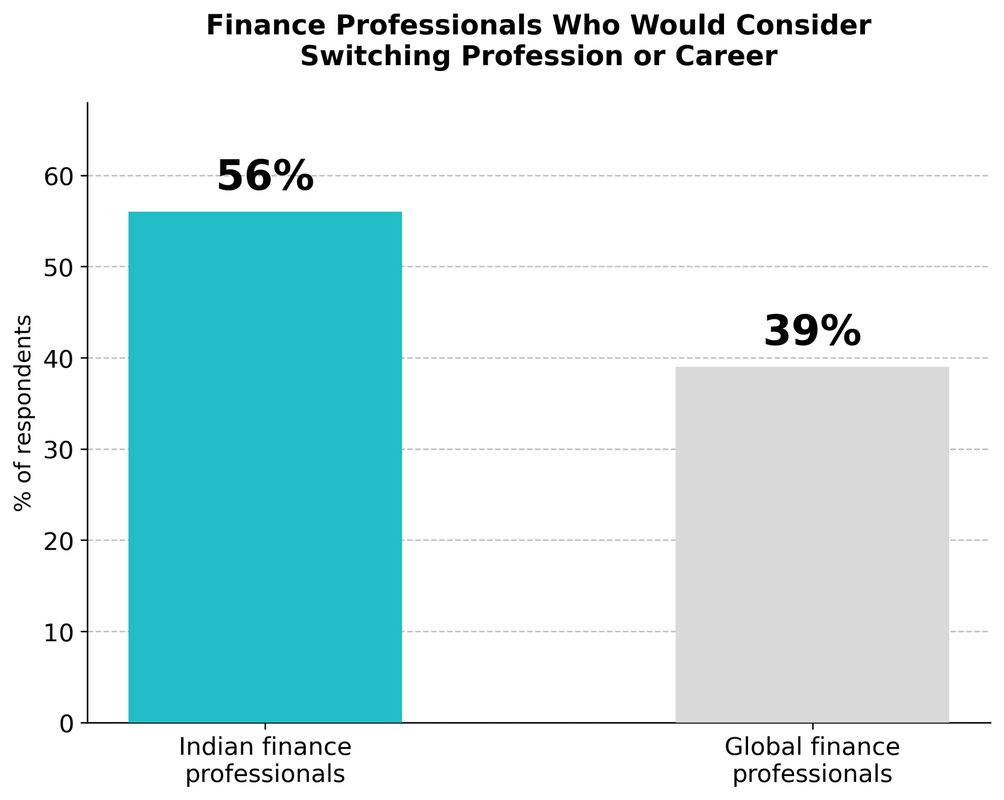
- 56% of Indian finance professionals said they would consider switching to a different profession or career in the future, compared with 39% globally.
- 68% of Indian respondents aspired to become entrepreneurs or business owners, up from 63% in 2025 and above the global average of 54%.
10. Salary expectations and compensation
Salary expectations reflect how employees view their pay and career prospects. Data on planned salary negotiations, expected raises, and pay satisfaction helps explain compensation priorities, while distinguishing employee expectations from actual salary increases.
- 81% planned to ask their employer for a pay rise in 2026, up from 67% in 2025. This measures employees’ intentions to request a pay rise, not the share who actually received one.
- 68% of employees expected a pay rise of more than 10%, compared with 37% of respondents globally.
- Only 29% of Indian respondents were satisfied with their pay, compared with 36% globally.
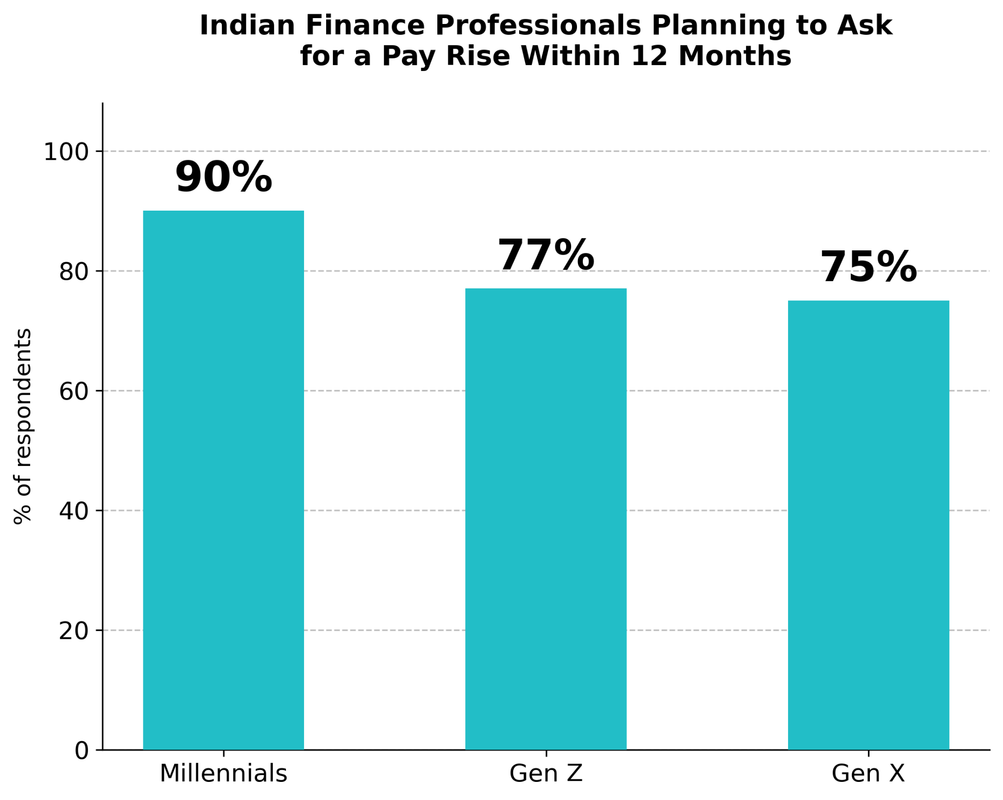
- Among Indian finance respondents, 90% of Millennials planned to ask for a pay rise within the next 12 months, compared with 77% of Gen Z and 75% of Gen X.
11. AI, automation and recruitment technology
AI is influencing workplace skills, recruitment perceptions, and professional development. The survey findings cover employees’ confidence in AI, access to training, concerns about automation, and adoption of AI tools in finance and accounting.
- 52% of Indian respondents were confident that AI algorithms could support fair and unbiased recruitment, compared with 43% globally. This measures confidence in AI-assisted recruitment, not the percentage of employers already using AI to hire.
- Confidence in AI-supported recruitment varied by generation: 54% among Gen Z, 48% among Gen Y, and 27% among Gen X.
- In 2026, 57% of Indian finance professionals used AI technologies in their current roles, while 86% felt confident in their ability to learn and apply AI-related skills.

- In 2026, 50% of Indian respondents said their organizations provided opportunities to learn AI-related skills, up from 37% in 2025.
- 39% reported that their organizations were deploying AI agents to support finance and accounting work.
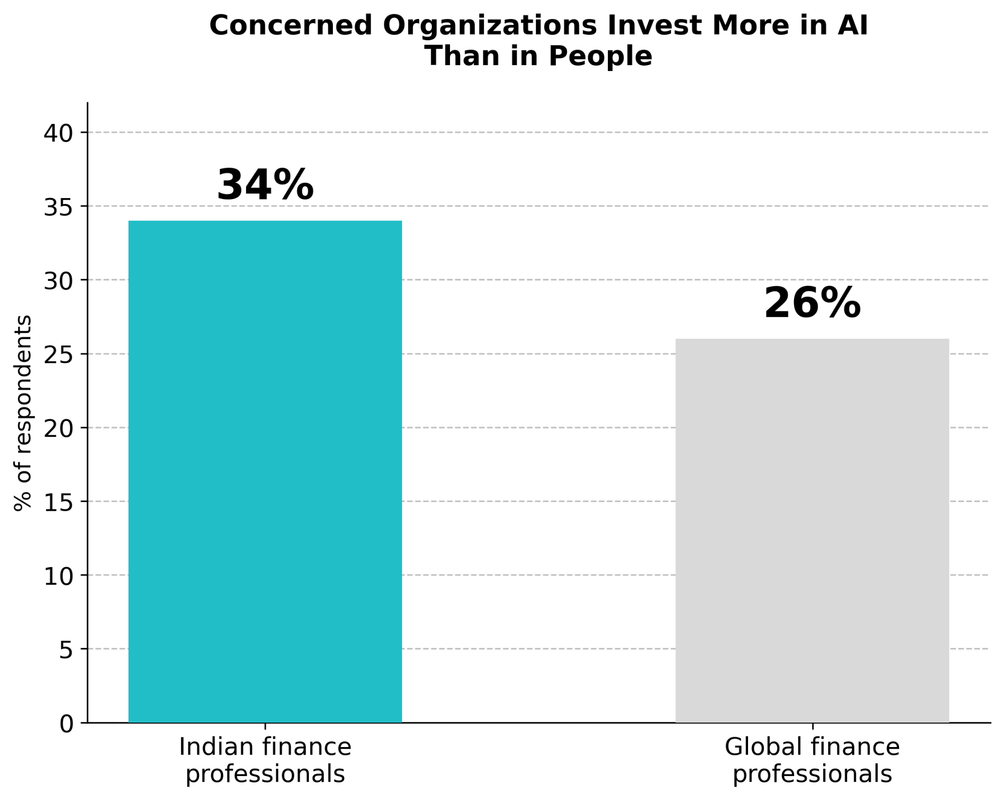
- 34% were concerned that their organizations were investing more in AI technologies than in people, compared with 26% globally.
- 57% were concerned about AI’s impact on their roles, while 53% felt overwhelmed by the pace of technological change affecting their jobs.
12. Work arrangements and employer preferences
Work arrangements and employer values can influence where people choose to work. Data on hybrid work preferences, office attendance, and social and environmental considerations help explain what surveyed professionals expect from employers.
- In 2026, 79% of Indian respondents preferred hybrid work, combining time at home with time in the office. Meanwhile, 53% were already working in a hybrid model, up from 45% in 2025.
- Despite the strong preference for hybrid work, 74% supported employers requiring employees to spend a set number of days in the office each week.
- 85% considered the company’s position or actions on social and human rights issues when deciding whether to work there, while 69% considered environmental issues a key factor in choosing an employer.

Final Words
Hiring statistics can help businesses identify where talent demand is growing, but workforce planning also involves onboarding, retention, and employee recognition. For companies expanding their teams, the right corporate gifts can make new joiners feel welcome, reward performance, and recognize work anniversaries.
TapWell offers customized welcome kits, branded merchandise, employee rewards, and curated gift hampers to support these initiatives. Businesses can also use TapWell’s custom company store, letting employees choose gifts within an allocated budget while TapWell manages sourcing, branding, and delivery.
👉 Talk to TapWell’s corporate gifting team to discuss your requirements and request a personalized quote.
Data Sources
- https://www.statista.com/topics/6583/employment-in-india/?srsltid=AU7gw4X2kh7AtQgX7OdxXr39zLjBfGyBwstDyN0XM87Kn9B_nTrU_uhw#topicOverview
- https://www.ilo.org/sites/default/files/2024-08/India%20Employment%20-%20web_8%20April.pdf
- https://dge.gov.in/sites/default/files/2024-06/Employment_Situation_in_India_April2024.pdf
- https://www.infoedge.in/pdfs/News_Events_pdfs/Naukri-Jobspeak-July-2026.pdf
- https://www.accaglobal.com/content/dam/gb/policy-and-insights/reports/2026/gtt-india-2026.pdf